EKS InTec
Company

Engineering expertise
with industrial focus

Learn more about EKS InTec, our locations, career opportunities and how to get in touch with our team.

EKS InTec Automation, simulation and engineering expertise.

Monitoring & Analysis

See what is happening. Understand why.

EKS InTec turns signals, production records and model-based data into a traceable view of plant behavior. Teams can monitor current states, reconstruct sequences, compare operating conditions and base decisions on reliable evidence.

Operational transparency

From raw signals to a readable process.

01 Current system state
02 Cycle-time behavior
03 Event context
04 State comparison

Observe. Structure. Explain.

Monitoring & Analysis uses real and virtual operating data to make production behavior visible during operation. Deviations, bottlenecks, timing effects and process relationships become traceable on a consistent data basis.

What it means

A reliable view of the system as it actually behaves.

Industrial systems generate large quantities of signals, events and time-based records. Individual values rarely explain what happened. The real value emerges when these sources are structured, placed in context and connected to the process they describe.

EKS InTec creates this context. We combine recorded or live production information with planning values, simulation data and clearly defined process descriptions. The result is a reproducible basis for assessment, validation and operational decisions.

01 Understand the current system state
02 Assess process performance from consistent records
03 Make operational decisions with traceable evidence
Why transparency matters

Turn process behavior into evidence.

Structured analysis creates transparency across real production processes and system states. Relationships, deviations and recurring patterns become understandable instead of remaining isolated signals.

Understand the current plant state
Assess production and timing behavior
Support safer operational decisions
Impact of Monitoring & Analysis

Visible

What actually happens in production becomes traceable.

Measurable

Process behavior can be assessed from consistent records.

Comparable

Planned, virtual and real states can be placed side by side.

Decision-ready

Findings become a reliable basis for operational decisions.

Two disciplines, one evidence base
Continuous visibility and detailed investigation.

Monitoring

Keep the current process state in view.

Monitoring provides an ongoing view of relevant states, signals, events and performance indicators. It helps teams recognize when production behavior changes and preserves the context needed for later investigation.

  • Current and historical system states
  • Signals, events and timing information
  • Cycle-time and workload visibility
  • Deviation and anomaly context
Analysis

Reconstruct sequences and trace relationships.

Analysis turns recordings into a structured process view. Teams can isolate relevant periods, compare operating states, investigate signal relationships and document why a process behaved differently.

  • Process and sequence reconstruction
  • Baseline and state comparison
  • Cycle-time, workload and distribution assessment
  • Root-cause investigation and documentation

What becomes transparent

A structured view across the production process.

01

Current system state

See which process states, equipment conditions and operating modes are active at a specific point in time.

02

Cycle time and workload

Assess timing behavior, workload distribution and recurring variations across production sequences.

03

Events and downtime context

Connect messages, state changes and interruptions to the process phase in which they occurred.

04

Deviations and bottlenecks

Identify where process behavior differs from the expected sequence and where constraints repeatedly appear.

05

Signal relationships

Inspect signals at source level and understand how individual values relate to complete process steps.

06

Changes and baselines

Compare defined operating states before and after a controlled change using the same assessment basis.

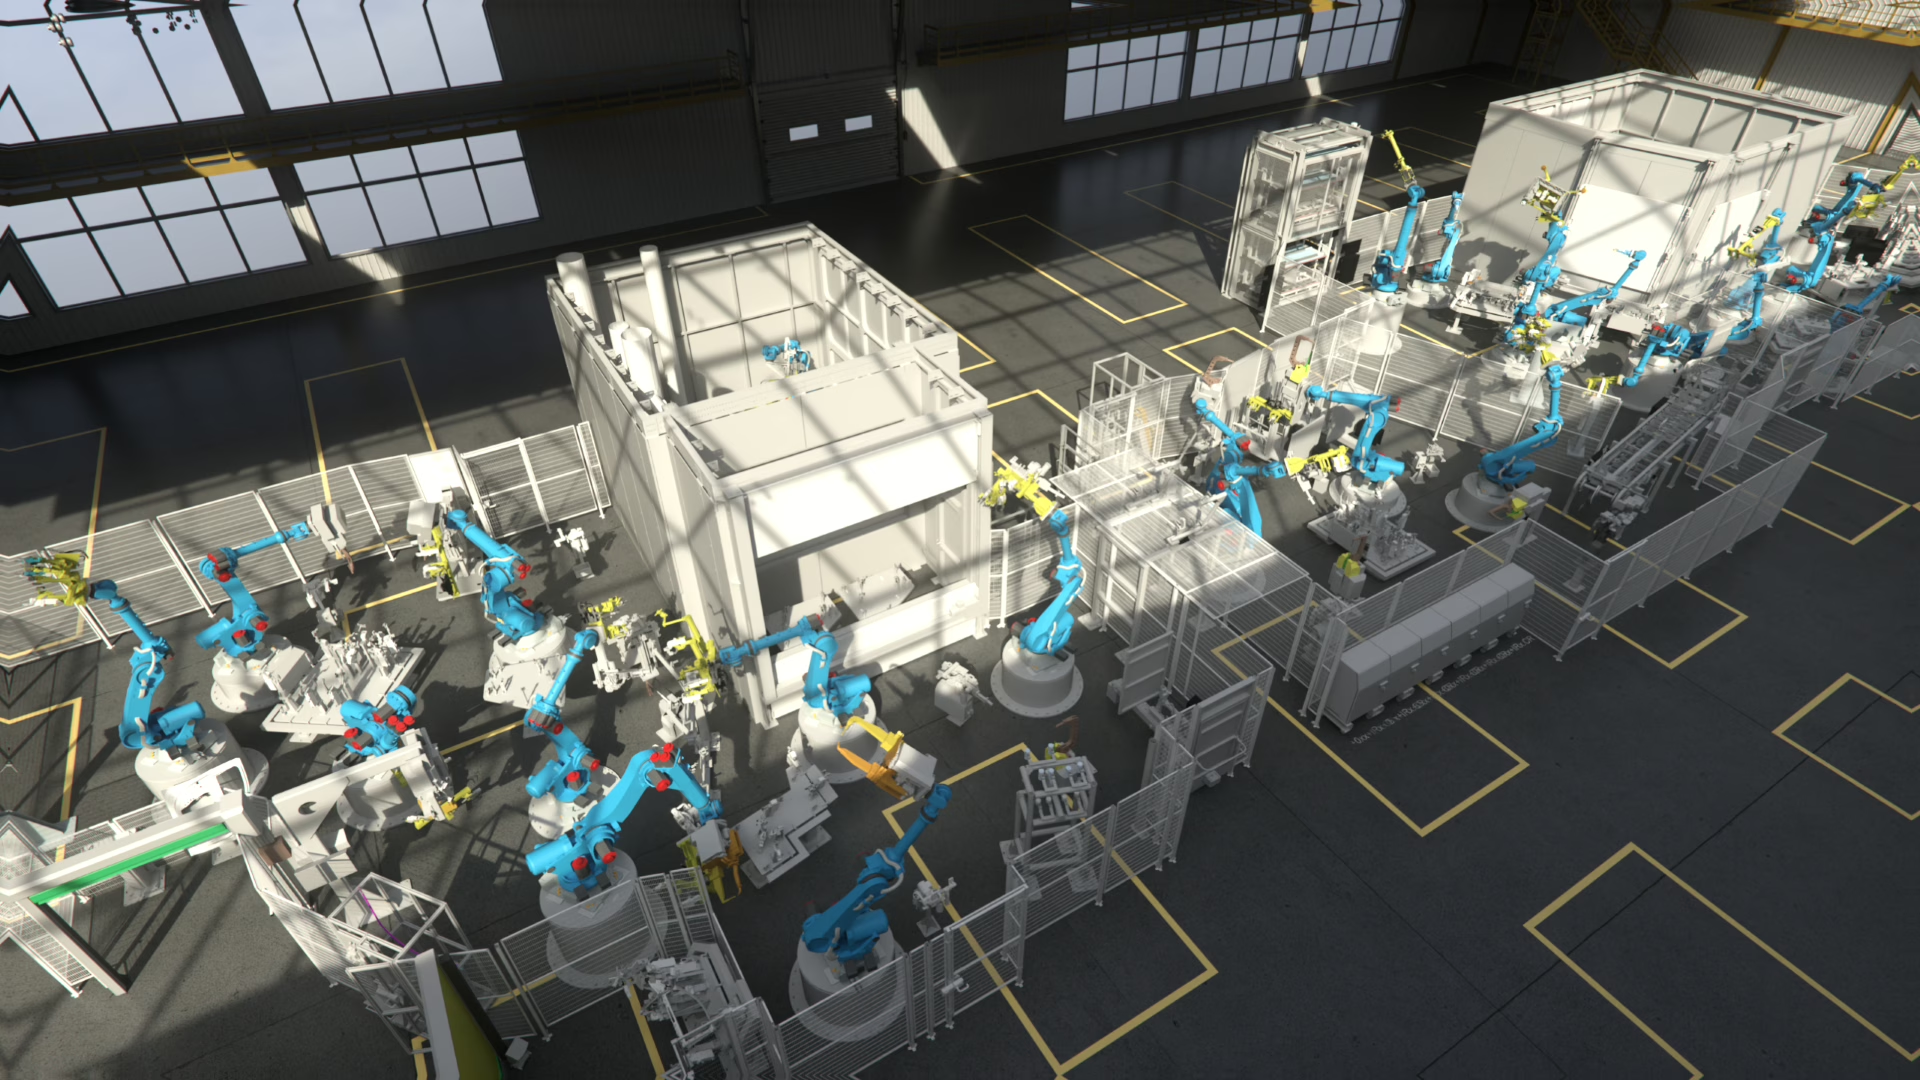
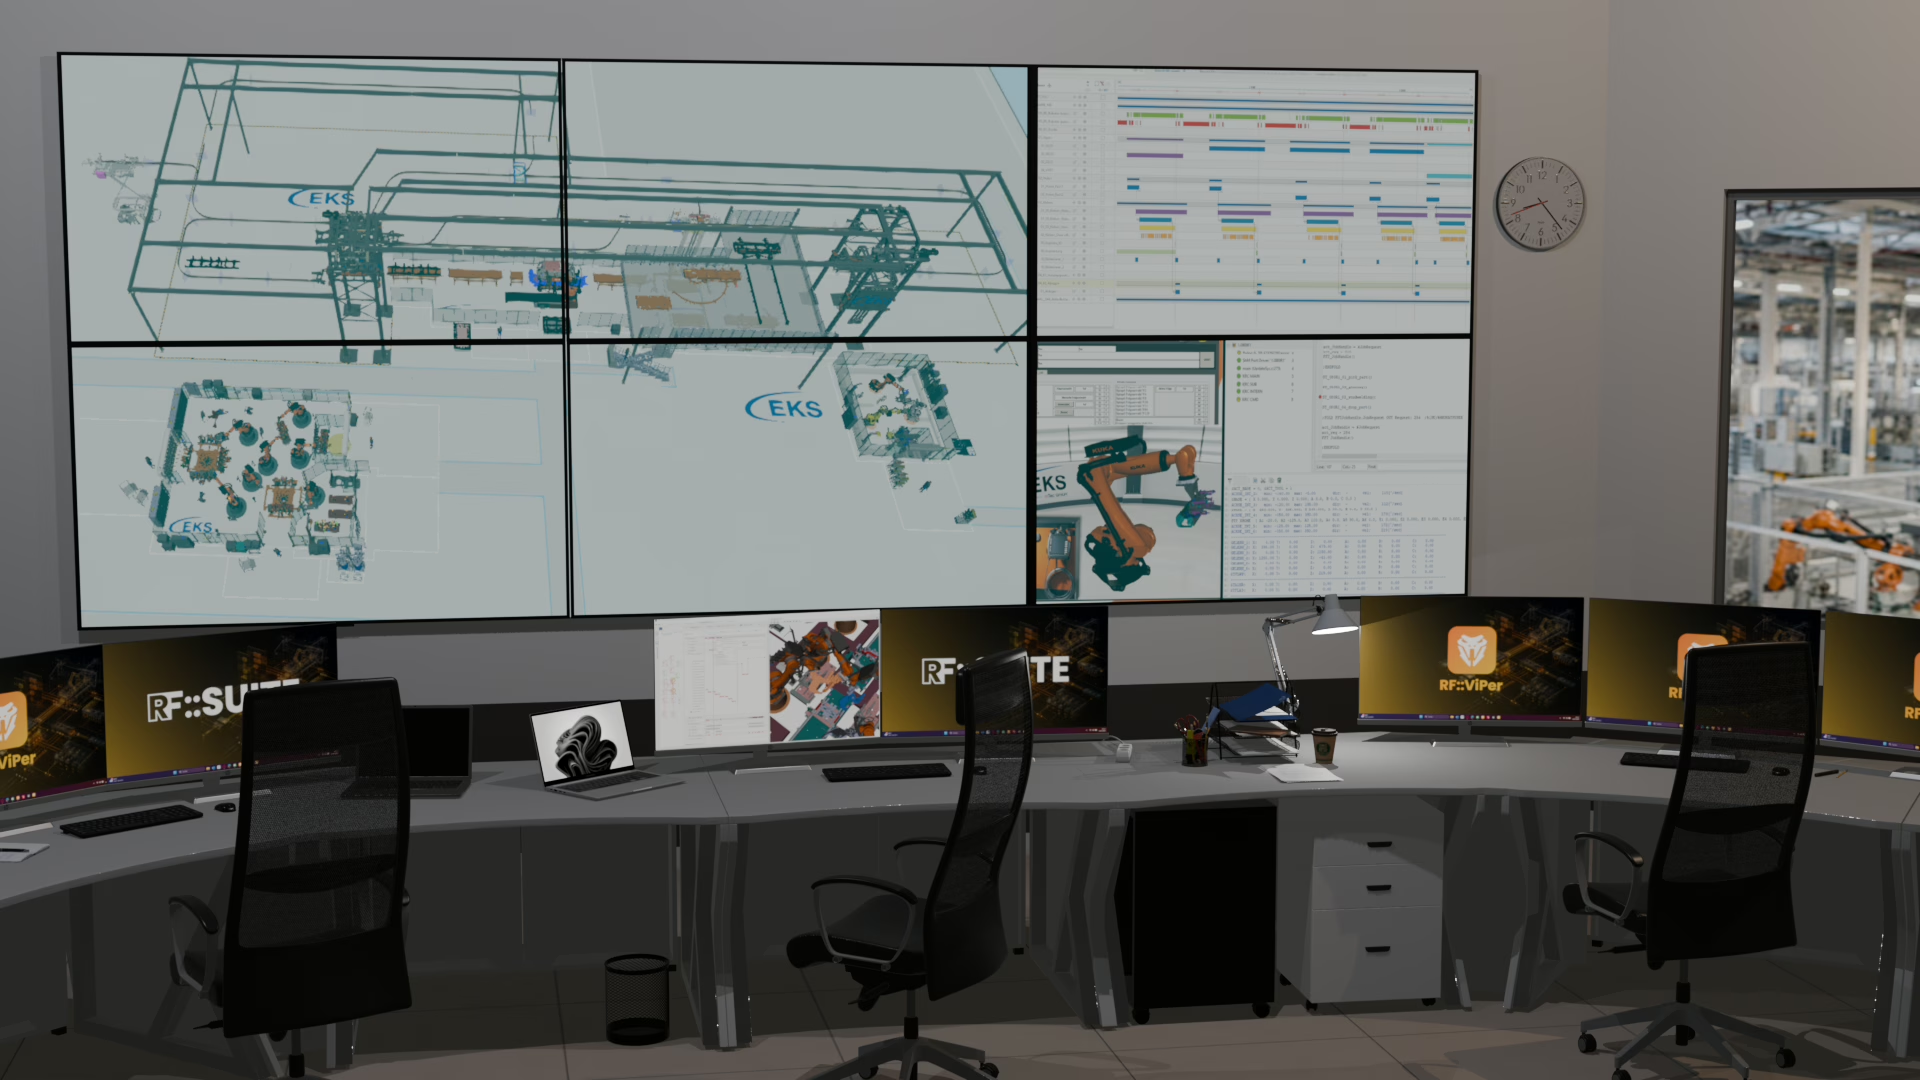
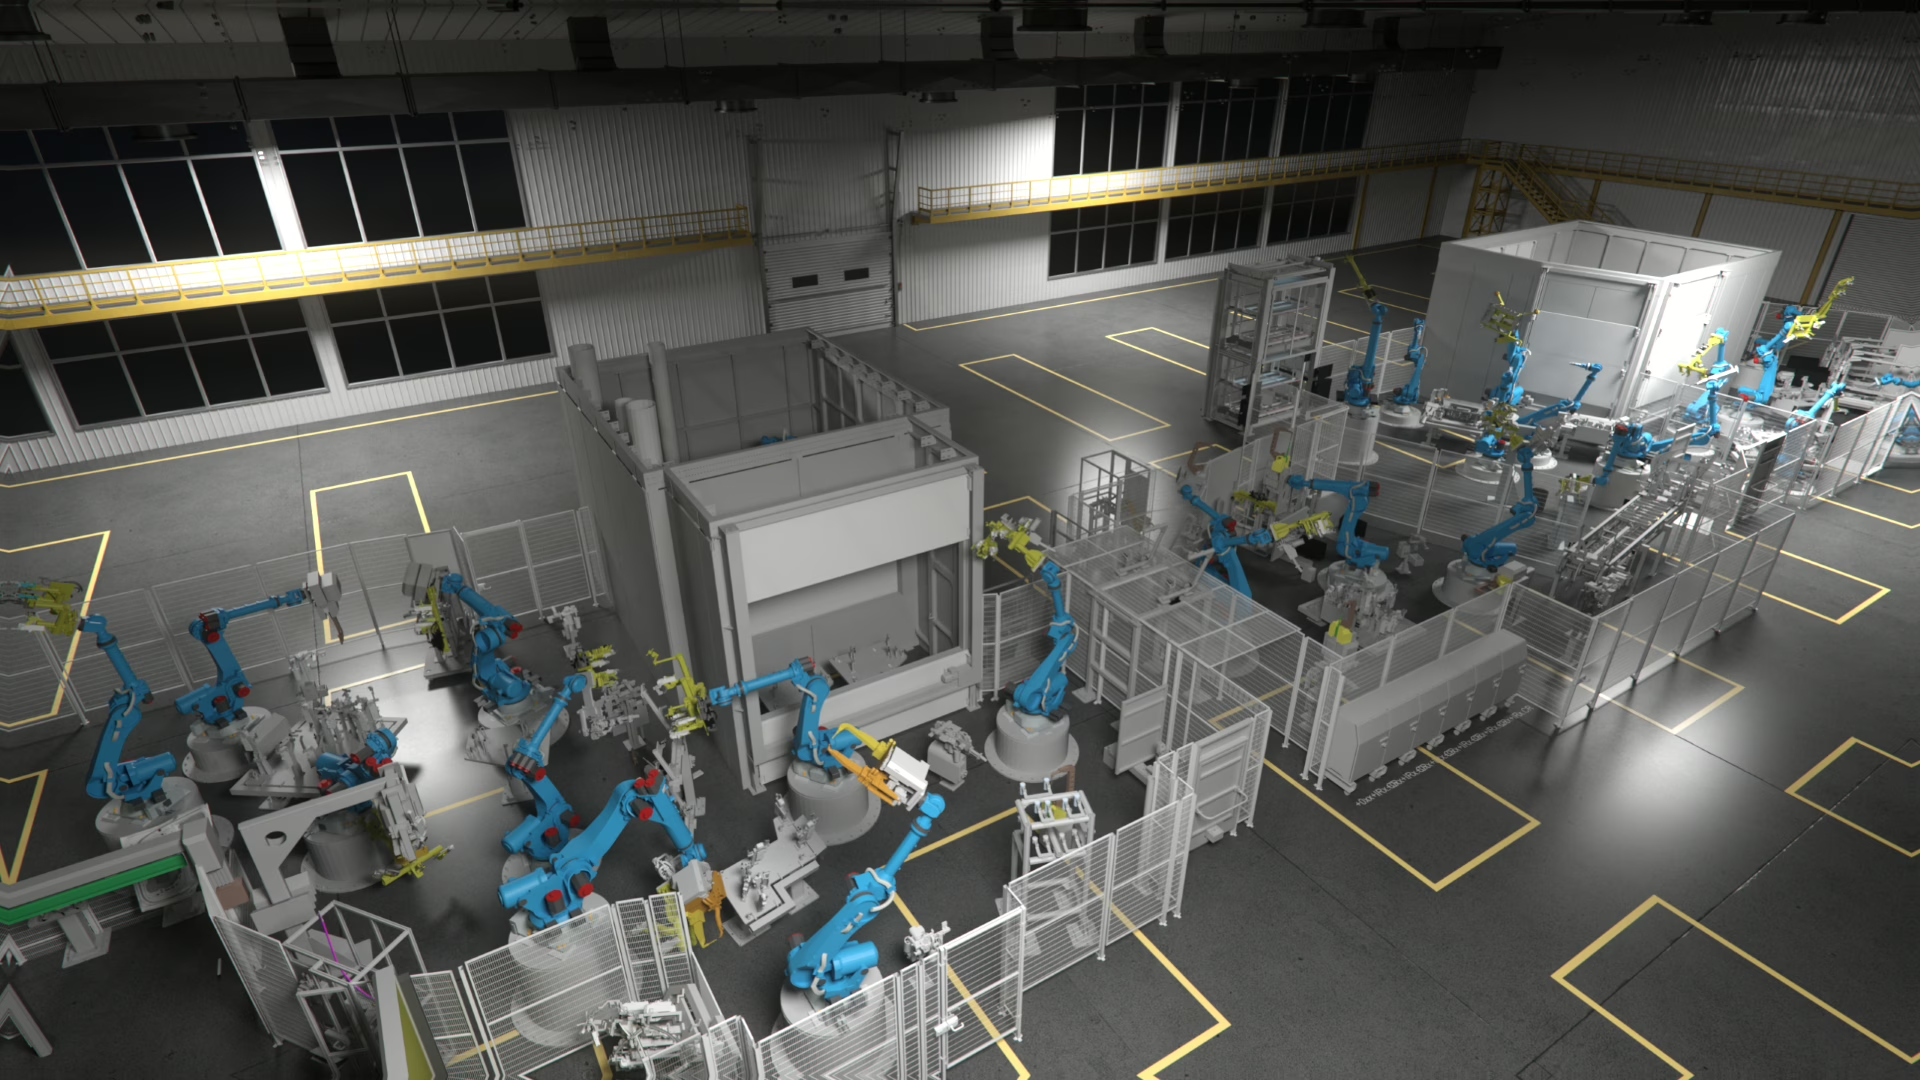
Connected virtual production environment used to place industrial data in context
A useful analysis does not stop at a signal value. It connects the value to the asset, process step, operating mode and point in time in which it occurred.

The data foundation

Different sources. One understandable process view.

Production behavior is distributed across multiple systems. Monitoring & Analysis creates a shared time and process context without reducing complex behavior to a single dashboard value.

01

PLC and control signals

States, commands, acknowledgements and interlocks from automation systems.

02

Robot and equipment events

Program states, interactions, motion-related events and equipment messages.

03

Sensor and production records

Time-series data, counters, measured values and operating information.

04

Simulation and planning references

Expected sequences, planned timings and virtual operating states for comparison.

05

Asset and project context

System structure, versions, documentation and defined assessment criteria.

Questions the data should answer

Move from symptoms to process understanding.

The purpose of analysis is not to create more charts. It is to shorten the path from an observed event to a technically defensible explanation.

When did the behavior begin to change?

Compare time periods and operating states to locate the first measurable deviation.

Which event occurred immediately before a stop?

Connect messages, signals and sequence states instead of assessing them in isolation.

Is a timing deviation occasional or recurring?

Use repeated recordings and distributions to distinguish a single event from a pattern.

Which station or interaction constrains the sequence?

Review workloads, dependencies and waiting phases across connected equipment.

How does the real state differ from the reference?

Place production recordings beside planning values or virtual system behavior.

Which signals describe the relevant process step?

Narrow large recordings to the values and time window that explain the event.

What changed between two operating states?

Relate documented system changes to their measurable effects in the process.

Can another team reproduce the assessment?

Preserve source data, criteria and context so findings remain traceable.

RF::SUITE software

The tools behind production transparency.

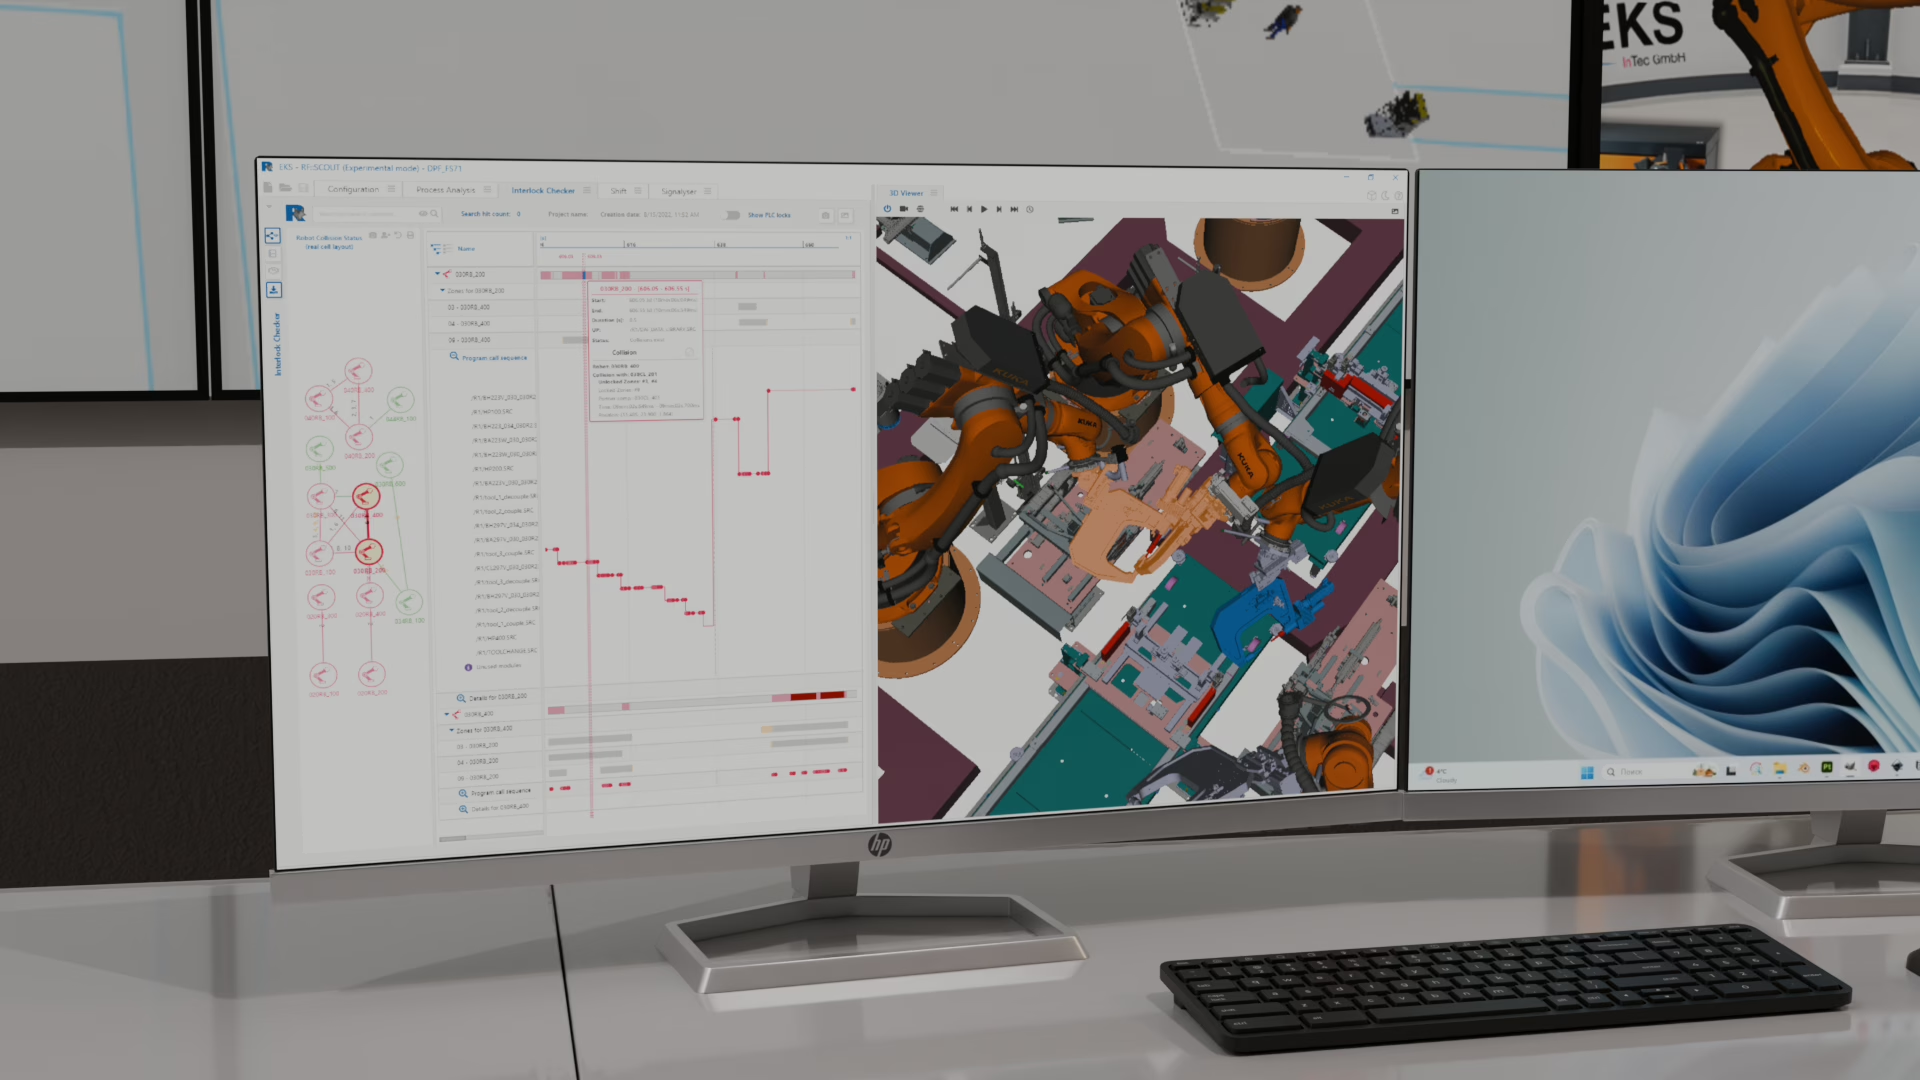
RF::SCOUT provides the detailed production-analysis environment. RF::CEREB is being developed as the connected information layer that preserves relationships between engineering, simulation, production and training knowledge.

RF::SCOUT icon
Production analysis

RF::SCOUT

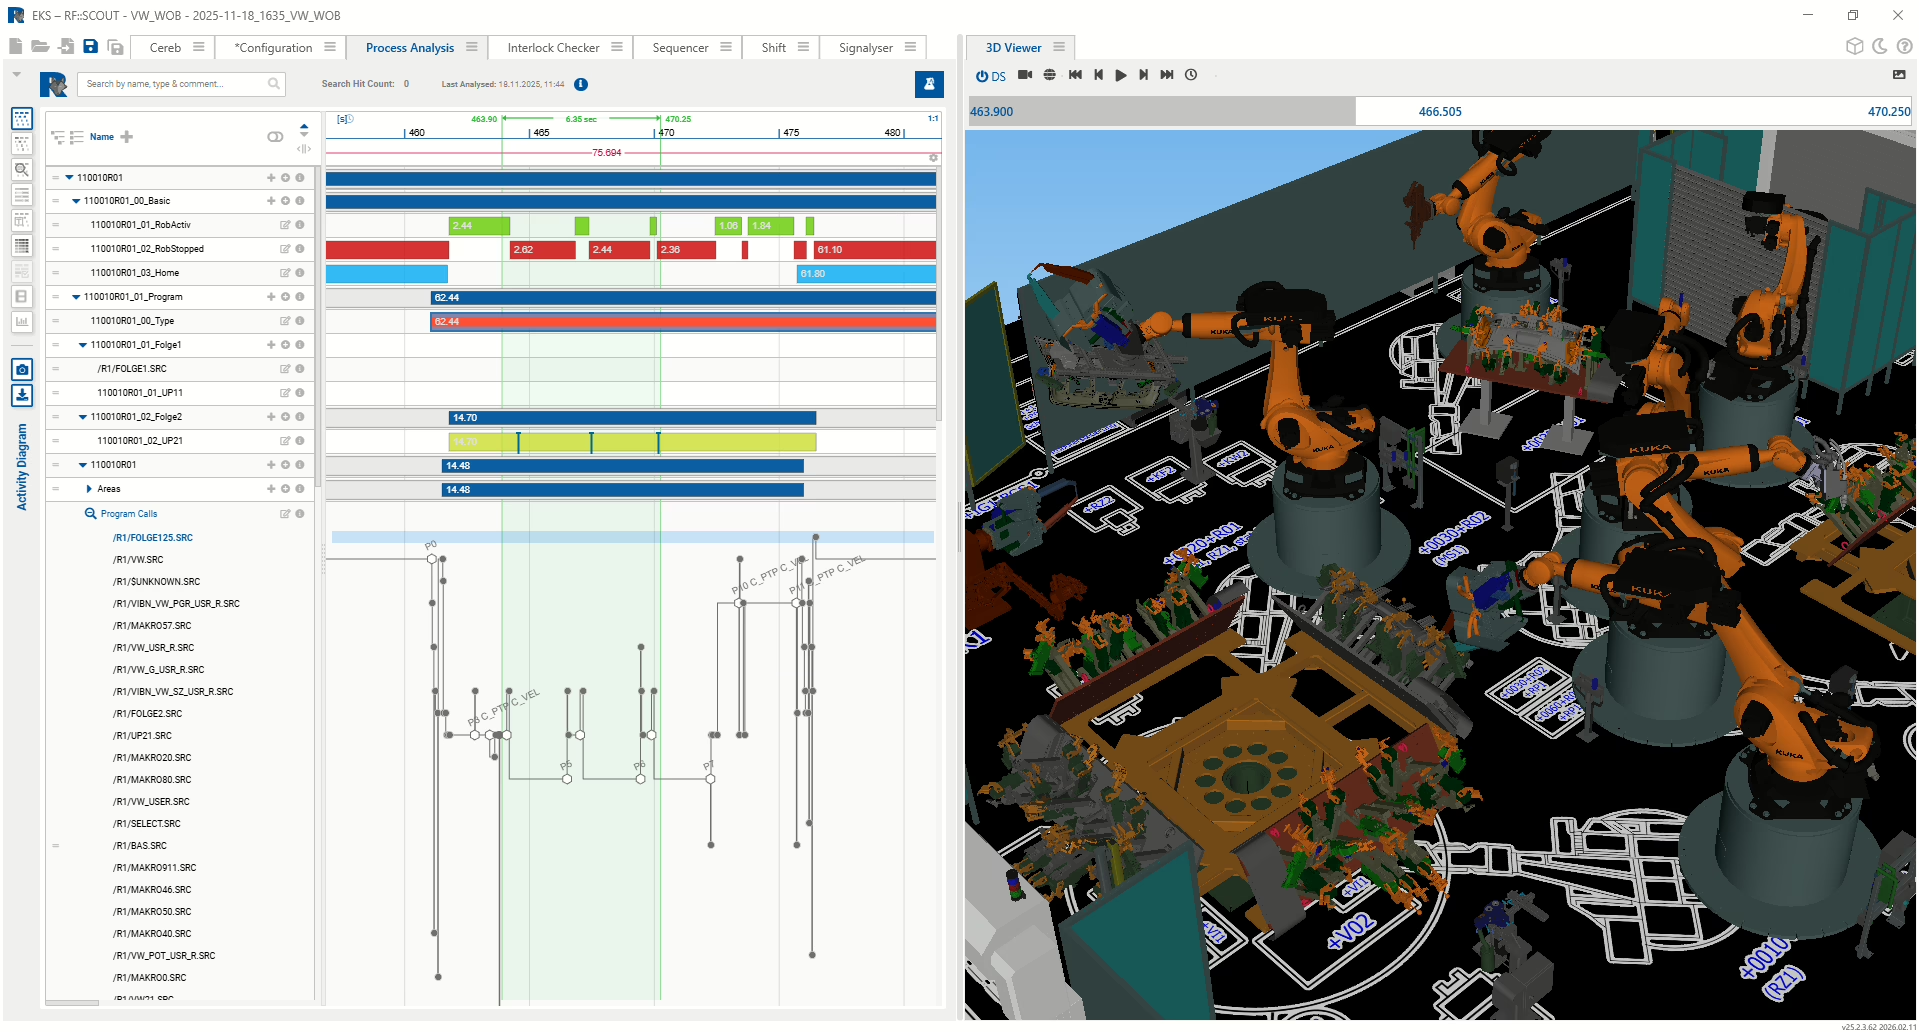
RF::SCOUT structures recordings from real or virtual systems into readable process timelines, signal views and comparable operating sequences.

  • Process timelines and Gantt-based views
  • Cycle-time, workload and distribution assessment
  • Detailed signal inspection with Signalyser
  • Recorded-sequence analysis with Sequencer
  • Interlock and interaction analysis where required
RF::SCOUT production analysis interface
RF::CEREB icon
Future RF::SUITE module

RF::CEREB

RF::CEREB is being developed to connect lifecycle information that is usually distributed across project files, simulation environments, production systems and organizational knowledge.

  • Connected engineering and operational context
  • Continuity between simulation and production knowledge
  • Traceability of information changes over time
  • Knowledge retention beyond individual project phases
  • Connectivity across RF::SUITE workflows
RF::CEREB connected lifecycle information
Clear responsibility: Monitoring & Analysis provides transparency, evidence and decision support. It does not autonomously change control logic, parameters or production sequences in the running plant.

From data to evidence

A consistent workflow for traceable results.

01

Connect

Bring together relevant PLC, robot, sensor, planning or simulation sources.

02

Record

Capture time-based signals, events and process states with the required detail.

03

Contextualize

Relate raw values to equipment, process steps and defined operating states.

04

Compare

Place periods, baselines, variants or virtual and real states side by side.

05

Document

Preserve findings as a reproducible basis for validation and decisions.

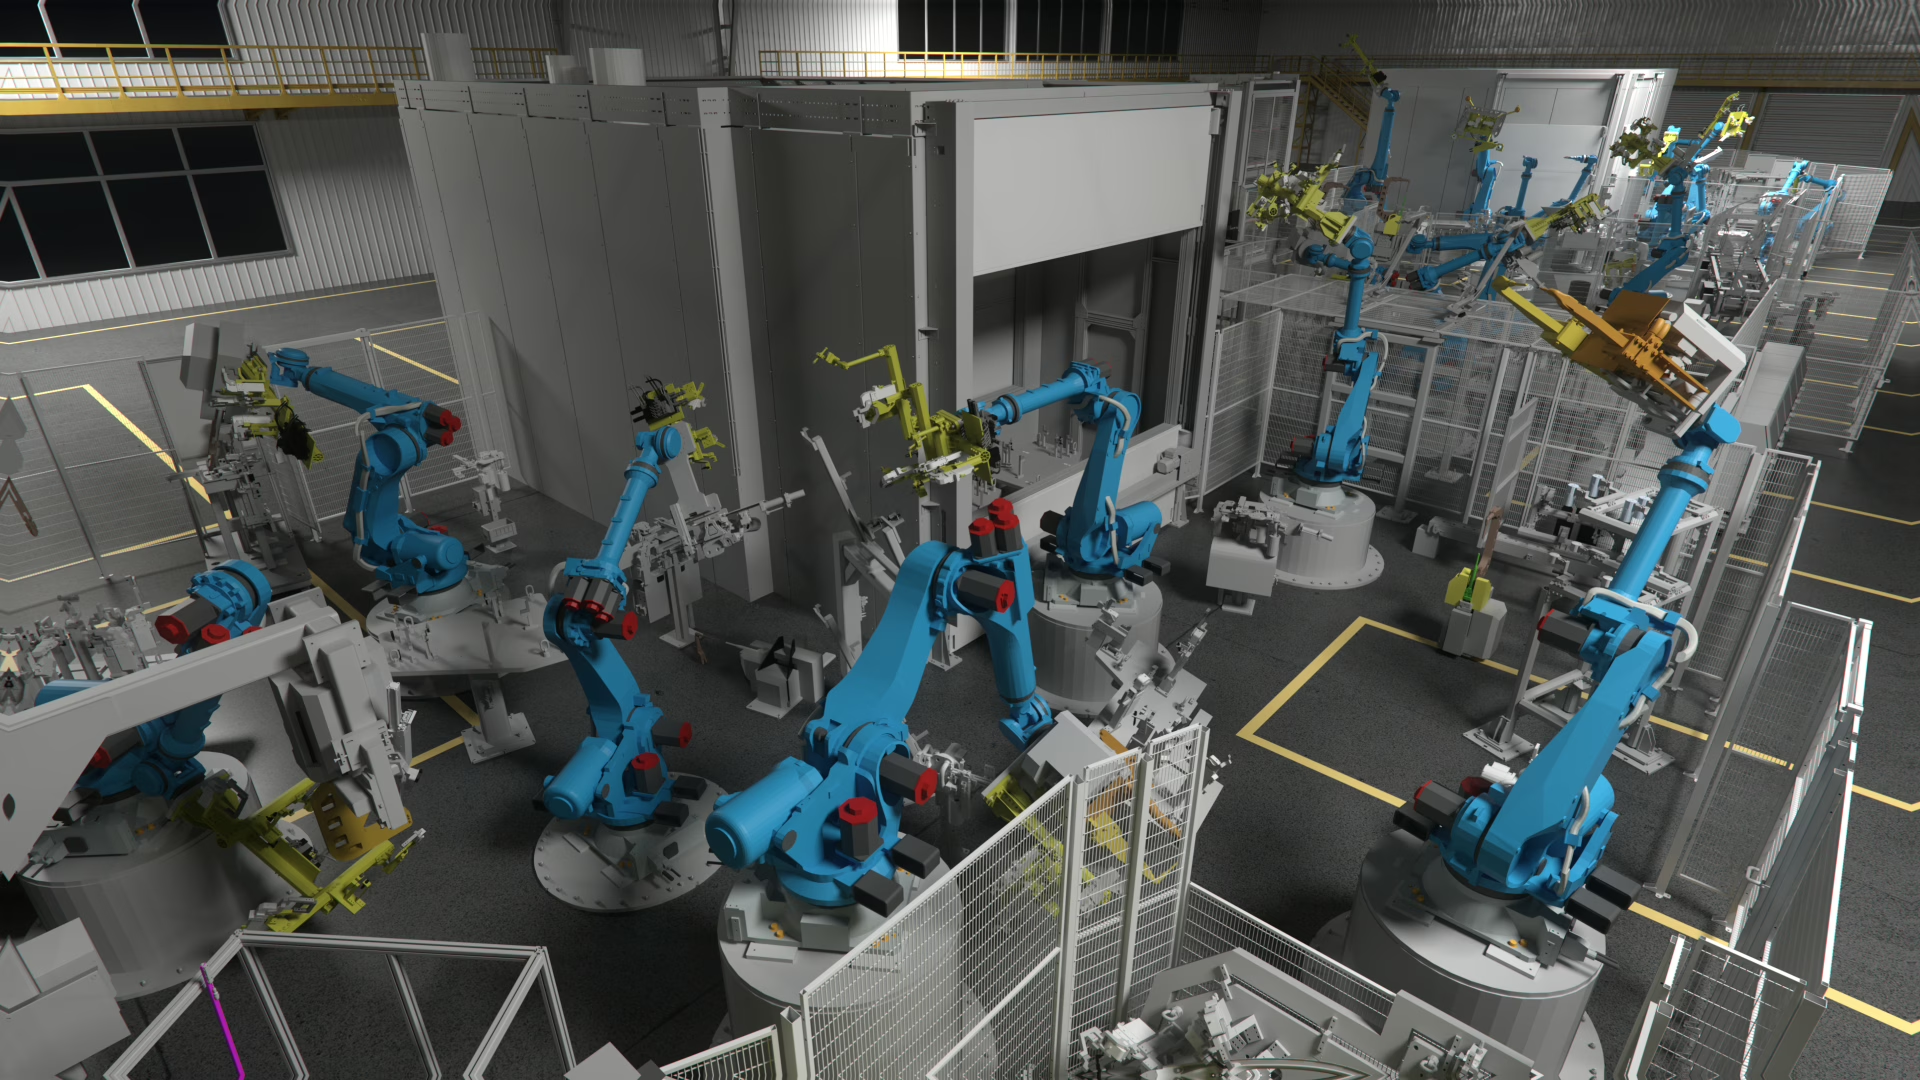
Detailed industrial process recording prepared for analysis
Gapless records preserve the order and timing of process events. This allows teams to return to the exact operating window later, isolate the relevant sequence and assess it with the same data basis.
Validation

Validate changes with traceable evidence.

Real process data makes the effects of controlled changes understandable. Defined baselines and consistent assessment criteria allow teams to compare operating states and document whether the expected behavior was achieved.

01

Establish a baseline

Record the relevant operating state before a change so later comparisons use a reliable reference.

02

Compare operating states

Place before-and-after behavior side by side using the same process and timing criteria.

03

Trace the effects

Investigate how a defined change influences process behavior, stability, timing and interactions.

04

Support controlled restart

Use documented evidence to assess the system state and reduce uncertainty during restart.

Where it creates value

Monitoring & Analysis across real project situations.

Ramp-up

Observe the transition into production

Document how sequences, timings and interactions behave as a new or modified system moves from commissioning into regular operation.

Diagnostics

Investigate recurring interruptions

Return to the relevant event window, reconstruct the sequence and narrow the search to the states that preceded the interruption.

Digital continuity

Compare virtual and real behavior

Use the same process description to contrast virtual commissioning records, planned values and later production behavior.

Validation

Assess controlled system changes

Define a baseline, record the new state and document whether the expected effect is visible under comparable conditions.

Line analysis

Understand cross-station dependencies

Trace waiting phases, handovers and interactions across connected equipment instead of reviewing each station in isolation.

Knowledge transfer

Preserve context beyond the incident

Keep recordings, assessment criteria and technical conclusions accessible for maintenance, engineering and future project teams.

Who uses the evidence

One shared process view for different responsibilities.

Production management

Assess operating behavior and make decisions from a consistent production view.

Process planning

Compare planned sequences with virtual and real operating states.

PLC and robot engineering

Trace interactions, interlocks, signals and timing across complete sequences.

Commissioning teams

Reconstruct behavior and validate defined system states during ramp-up.

Maintenance

Investigate recurring events and connect symptoms to their process context.

Quality and data specialists

Work with structured records and reproducible criteria across departments.

Frequently asked questions

What teams need to know before they start.

Can real and virtual production data be analyzed together?
Yes. A shared process and time context makes it possible to compare records from virtual commissioning with data from the real system. The available depth depends on the interfaces, signal mapping and reference data provided by the project.
Does Monitoring & Analysis require a complete digital twin?
No. A project can begin with selected signals, events and process descriptions for one cell or sequence. Simulation models add further context where a virtual reference or model-based value is relevant.
Can historical recordings be used for later investigations?
Yes. Time-based recordings allow teams to return to a defined event window, isolate the relevant process step and assess the same sequence again without depending on the issue occurring live.
Does the system make autonomous changes to the running plant?
No. The scope described here is transparency, analysis, comparison and decision support. Control logic, parameters and production sequences remain under the responsibility of the authorized engineering and operations teams.
Can a project start with one machine or production cell?
Yes. A clearly defined pilot scope is often the most useful starting point. Data sources, process questions and assessment criteria can be established for one area before the approach is extended to additional equipment or lines.

Make production behavior visible

Turn operating data into traceable decisions.

Talk to EKS InTec about your monitoring requirements, analysis workflows, RF::SCOUT or RF::CEREB.

EKS Hub signup

We look forward to activating you for our customer portal. Please fill the fields bellow, we will notify you once access has been granted

Data protection information Your request is encrypted and transmitted to our server via HTTPS. You agree that we may use the information you provide to respond to your request. Further information can be found in our data protection declaration .